This guide explains the most common numbers they will see on a home sleep test (HST) or in-lab polysomnogram (PSG), what ranges tend to be considered normal, and which patterns usually trigger treatment.
What kind of sleep study did they have, and why does it matter?
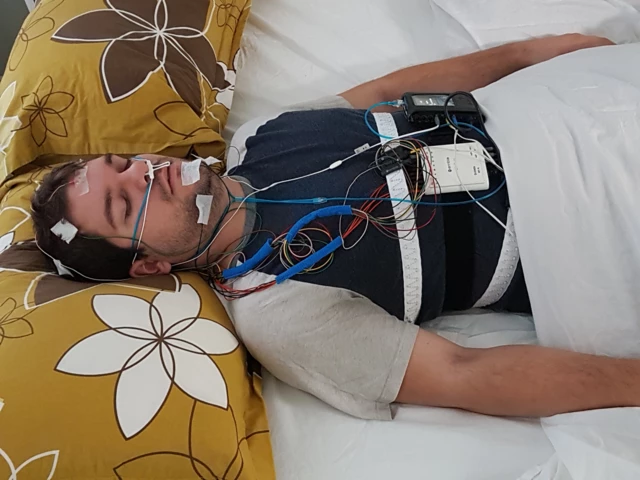
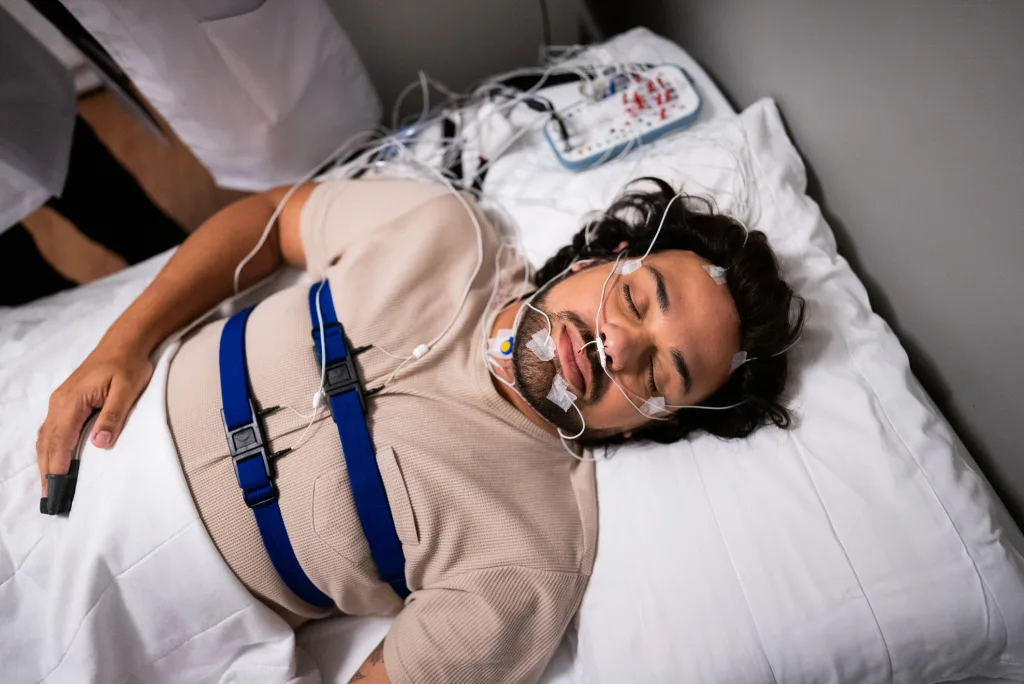
Understanding sleep study results is important because an HST typically measures breathing and oxygen, while a PSG measures breathing plus brain waves, leg movements, and precise sleep stages. If their report is from an HST, some “sleep” numbers are estimated, and indices can look better or worse depending on assumptions.
They should also note whether the results list AHI, REI, or RDI, since each can be calculated differently across study types and labs.
What is AHI (or REI), and what do the ranges mean?
AHI is the Apnea-Hypopnea Index: the average number of apneas and hypopneas per hour of sleep. On many home tests, the report may use REI (Respiratory Event Index), often calculated per hour of recording time rather than true sleep time.
Common adult categories are:
- Normal: < 5/hour
- Mild: 5 to 14.9/hour
- Moderate: 15 to 29.9/hour
- Severe: ≥ 30/hour
If their symptoms are strong but AHI looks low, it can be a sign the study missed events, sleep time was overestimated, or the problem is not classic obstructive sleep apnea.
What is the difference between apnea and hypopnea on their report?
An apnea is a near-complete pause in breathing, usually at least 10 seconds. A hypopnea is a partial reduction in airflow paired with either an oxygen drop or an arousal, depending on the lab’s scoring rules.
Their report may also label apneas as obstructive, central, or mixed. Obstructive means the airway collapses; central means the brain’s breathing drive briefly pauses; mixed starts central and ends obstructive.
What does oxygen saturation (SpO₂) tell them?
SpO₂ numbers show how well oxygen stays stable during sleep. Reports often list average SpO₂, minimum (nadir) SpO₂, and time below a threshold (commonly 90%).
A brief dip may be less concerning than long, repeated time below 90%. If their nadir is very low or they spend meaningful time under 90%, clinicians often treat more urgently or evaluate for other lung or heart issues, especially if the AHI is not very high.
What is the ODI number, and why can it disagree with AHI?
ODI is the Oxygen Desaturation Index: how many times per hour oxygen drops by a set amount (often 3% or 4%). ODI can be high when events cause desaturations but arousals are not clearly measured, which is common on some home tests.
It can also be low when someone has frequent arousals without big oxygen drops. That pattern can still cause severe sleepiness, even if oxygen looks “fine.”
What is the arousal index, and what does it say about sleep quality?
The arousal index is the number of brief awakenings per hour of sleep, typically scored on PSG using brainwave changes. A higher arousal index suggests fragmented sleep, which can drive fatigue, headaches, and poor concentration.
If their arousal index is high but AHI is modest, the clinician may look for UARS, insomnia-related fragmentation, periodic limb movements, pain, reflux, medications, or environmental disruption.
What are RDI and RERAs, and why might they matter more than AHI?
RDI (Respiratory Disturbance Index) often includes apneas and hypopneas plus additional breathing events such as RERAs. A RERA (Respiratory Effort-Related Arousal) is increased breathing effort that ends in an arousal but may not meet hypopnea criteria.
If their AHI is low but RDI is elevated, it can explain symptoms and can still support treatment in some settings.
What do sleep stages mean, and how much is “normal”?
Sleep stages usually include N1, N2, N3 (deep sleep), and REM. PSG reports show percentages and total minutes of each stage, plus REM latency.
Typical adult ranges vary, but many clinicians loosely expect:
- N1: ~5%
- N2: ~45% to 55%
- N3: ~15% to 25% (often less with age)
- REM: ~20% to 25%
If REM or N3 is very low, it often reflects fragmentation, medications, alcohol, untreated sleep apnea, circadian issues, or insufficient total sleep time during the study.
What is sleep efficiency, and should they worry if it is low?
Sleep efficiency is the percentage of time in bed actually spent asleep. Lower efficiency suggests insomnia, discomfort, anxiety in the lab, pain, frequent awakenings, or breathing-related disruption.
A single-night lab effect can lower efficiency even in healthy sleepers. The question is whether low efficiency matches their usual nights and whether the report also shows frequent awakenings, high arousals, or prolonged sleep onset.
What do “supine AHI” and “REM AHI” mean for their diagnosis?
Supine AHI shows how severe breathing events are while sleeping on the back. REM AHI shows severity during REM sleep, when muscle tone drops and obstruction often worsens.
If their AHI is mild overall but high in REM or supine position, treatment may still be reasonable. It can also guide options like positional therapy, head-of-bed elevation, or targeted PAP settings.
What do heart rate and “arrhythmia flags” mean on the report?
Many PSGs include ECG data, and home tests may estimate pulse rate. Brief heart-rate spikes often occur with arousals and oxygen drops.
If the report mentions significant arrhythmias, clinicians usually confirm with a dedicated cardiac evaluation. Sleep apnea can worsen rhythm issues, but a sleep study is not a full cardiology workup.
What do leg movement numbers (PLMI) mean, and when do they matter?
PLMI is the Periodic Limb Movement Index: repetitive leg kicks per hour of sleep, measured on PSG. A higher PLMI can fragment sleep, but it matters most when movements cause arousals or match symptoms like restless sleep or daytime sleepiness.
If PLMI is elevated, clinicians may check iron stores (ferritin), review medications, and consider restless legs syndrome or periodic limb movement disorder.
What should they do if the numbers do not match how they feel?
They should bring symptoms to the follow-up, not just the metrics. A “mild” AHI can still produce severe impairment, and a single night can under-sample REM or back-sleeping where apnea is worst.
If suspicion stays high, clinicians may repeat testing, request an in-lab PSG if the first test was home-based, or evaluate for other causes like insomnia, circadian rhythm disorders, narcolepsy, depression, thyroid disease, or medication side effects.
What are the most practical takeaways they can use immediately?
They can interpret most sleep study reports by focusing on three buckets: breathing events (AHI/RDI), oxygen burden (nadir and time below 90%), and fragmentation (arousals and efficiency). If any bucket is clearly abnormal, it usually explains symptoms and guides treatment.
If anything is unclear, they should ask the clinician which index was used, what rules defined hypopneas, and whether the study captured enough REM and back-sleeping to reflect a typical night.
FAQs (Frequently Asked Questions)
What are the differences between a home sleep test (HST) and an in-lab polysomnogram (PSG), and why do they matter?
An HST primarily measures breathing and oxygen levels, providing estimated sleep data, while a PSG offers a comprehensive view including breathing, brain waves, leg movements, and precise sleep stages. The type of study affects how metrics like AHI, REI, or RDI are calculated and interpreted, which is crucial for accurate diagnosis and treatment planning.
What is the Apnea-Hypopnea Index (AHI), and how are its ranges classified?
AHI represents the average number of apneas (complete pauses) and hypopneas (partial reductions) in breathing per hour of sleep. Common adult AHI categories are: Normal (<5/hour), Mild (5-14.9/hour), Moderate (15-29.9/hour), and Severe (≥30/hour). These ranges help determine the severity of obstructive sleep apnea and guide treatment decisions.
How does oxygen saturation (SpO₂) affect the interpretation of a sleep study report?
SpO₂ indicates how well oxygen levels remain stable during sleep. Key metrics include average SpO₂, minimum (nadir) SpO₂, and time spent below 90%. Prolonged or frequent dips below 90% may prompt urgent treatment or further evaluation for lung or heart issues, especially if AHI is not significantly elevated.
What is the Oxygen Desaturation Index (ODI), and why might it differ from AHI values?
ODI measures how many times per hour oxygen drops by a set percentage (usually 3% or 4%). It can be high when oxygen desaturations occur without clear arousals—common in some home tests—or low when frequent arousals happen without significant oxygen drops. This discrepancy highlights different aspects of sleep-disordered breathing severity.
What does the arousal index reveal about sleep quality in a polysomnogram?
The arousal index counts brief awakenings per hour of sleep detected via brainwave changes. A higher arousal index indicates fragmented sleep, which can cause fatigue, headaches, and concentration issues. Elevated arousals with modest AHI may suggest other conditions like UARS, insomnia, limb movements, pain, or environmental factors affecting sleep quality.
Why are Respiratory Disturbance Index (RDI) and Respiratory Effort-Related Arousals (RERAs) important beyond AHI measurements?
RDI includes apneas, hypopneas, plus additional events like RERAs—breathing efforts ending in arousals that don’t meet hypopnea criteria. An elevated RDI despite low AHI can explain persistent symptoms and support treatment decisions by capturing subtle breathing disturbances affecting sleep quality.
See Also: Level 3 sleep study vs in-lab testing: what’s the difference?